
Page 156 - URA Annual Report 2021-22
P. 156
NOTES TO THE FINANCIAL STATEMENTS
(expressed in Hong Kong Dollars)
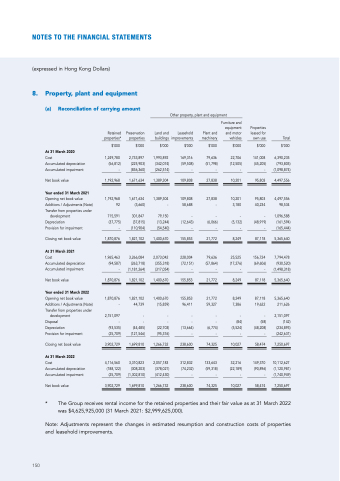
8. Property, plant and equipment (a) Reconciliation of carrying amount
Other property,
Leasehold improvements
$’000
169,316 (59,508) -
109,808
109,808 58,688
- (12,643) -
155,853
228,004 (72,151) -
155,853
155,853 96,411
-
- (13,664) -
238,600
312,832 (74,232) -
plant and equipment
At 31 March 2020
Cost
Accumulated depreciation Accumulated impairment
Net book value
Year ended 31 March 2021
Opening net book value Additions / Adjustments (Note) Transfer from properties under
development Depreciation
Provision for impairment
Closing net book value
At 31 March 2021
Cost
Accumulated depreciation Accumulated impairment
Net book value
Year ended 31 March 2022
Opening net book value Additions / Adjustments (Note) Transfer from properties under
development Disposal
Depreciation
Provision for impairment
Closing net book value
At 31 March 2022
Cost
Accumulated depreciation Accumulated impairment
Net book value
properties* $’000
1,249,780 (56,812) -
1,192,968
1,192,968 92
715,591 (37,775) -
1,870,876
1,965,463 (94,587) -
1,870,876
1,870,876 -
2,151,097 - (93,535)
(25,709)
3,902,729
4,116,560 (188,122) (25,709)
3,902,729
properties $’000
2,733,897 (225,903) (836,360)
1,671,634
1,671,634 (3,660)
301,847 (37,815) (110,904)
1,821,102
3,266,084 (263,718) (1,181,264)
1,821,102
1,821,102 44,739
-
- (44,485) (121,546)
1,699,810
3,310,823 (308,203) (1,302,810)
1,699,810
Total $’000
6,390,235 (793,805) (1,098,874)
4,497,556
4,497,556 98,534
1,096,588 (161,594) (165,444)
5,365,640
7,794,478 (930,520) (1,498,318)
5,365,640
5,365,640 211,626
2,151,097 (142) (234,893) (242,631)
7,250,697
10,112,627 (1,120,981) (1,740,949)
Retained Preservation
Land and buildings
$’000
1,993,892 (342,074) (262,514)
1,389,304
1,389,304 -
79,150 (13,244) (54,540)
1,400,670
2,073,042 (355,318) (317,054)
1,400,670
1,400,670 (15,859)
-
- (22,703) (95,376)
1,266,732
2,057,183 (378,021) (412,430)
1,266,732
Plant and machinery
$’000
79,636 (51,798) -
27,838
27,838 -
- (6,066) -
21,772
79,636 (57,864) -
21,772
21,772 59,327
-
- (6,774) -
74,325
133,643 (59,318) -
Furniture and equipment and motor
vehicles $’000
22,706 (12,505) -
10,201
10,201 3,180
- (5,132) -
8,249
25,525 (17,276) -
8,249
8,249 7,386
- (84) (5,524)
-
10,027
32,216 (22,189) -
Properties leased for own use
$’000
141,008 (45,205) -
95,803
95,803 40,234
- (48,919) -
87,118
156,724 (69,606) -
87,118
87,118 19,622
- (58) (48,208)
-
58,474
149,370 (90,896) -
238,600 74,325 10,027 58,474 7,250,697
150
* The Group receives rental income for the retained properties and their fair value as at 31 March 2022 was $4,625,925,000 (31 March 2021: $2,999,625,000).
Note: Adjustments represent the changes in estimated resumption and construction costs of properties and leasehold improvements.
